scludam.synthetic module
Module for synthetic data generation.
Contains some helpful functions and distributions and the main classes for generating synthetic sky region samples with an star field and star clusters.
- scludam.synthetic.is_inside_circle(center: ]], radius: Number, data: ]]) ndarray[Any, dtype[bool]][source]
Check if data is inside a circle.
- Parameters:
center (Vector2) – list, touple of numpy array of 2 number elements, representing the center of the circle
radius (Number) – radius of the circle
data (Union[Vector2, Vector2Array]) – numpy numeric array of shape (n, 2) to check if inside the circle
- Returns:
mask indicating if data is inside the circle.
- Return type:
NDArray[bool]
- scludam.synthetic.is_inside_sphere(center: ]], radius: Number, data: ]]) ndarray[Any, dtype[bool]][source]
Check if data is inside a sphere.
- Parameters:
center (Vector3) – list, touple of numpy array of 3 number elements, representing the center of the sphere
radius (Number) – radius of the sphere
data (Union[Vector3, Vector3Array]) – numeric array of shape (n, 3) to check if inside the sphere
- Returns:
mask indicating if data is inside the sphere.
- Return type:
NDArray[bool]
- scludam.synthetic.cartesian_to_polar(coords: ]]) shape[1] == 3]][source]
Convert cartesian coordinates to polar coordinates.
Cartesian coordinates are taken as (x, y, z) in parsecs in ICRS system and are transformed to (ra, dec, parallax).
- Parameters:
coords (Union[Vector3, Vector3Array]) – cartesian coordinates in (x, y, z) in parsecs in ICRS system to be transformed to (ra, dec, parallax).
- Returns:
polar coordinates in (ra, dec, parallax).
- Return type:
Union[Vector3, Vector3Array]
- scludam.synthetic.polar_to_cartesian(coords: ]]) shape[1] == 3]][source]
Convert polar coordinates to cartesian coordinates.
Polar coordinates are taken as (ra, dec, parallax) in (degree, degree, mas) in ICRS system and are transformed to (x, y, z) in parsecs in ICRS system.
- Parameters:
coords (Union[Vector3, Vector3Array]) – polar coordinates in (ra, dec, parallax) in (degree, degree, mas) in ICRS system.
- Returns:
cartesian coordinates in (x, y, z) in parsecs in ICRS system.
- Return type:
Union[Vector3, Vector3Array]
- class scludam.synthetic.EDSD(w0: float, wl: float, wf: float, **kwargs)[source]
Bases:
rv_continuousClass to represent the EDSD distribution.
- Variables:
w0 (float) – Distribution zero point that indicates the lower limit
wl (float) – Parameter that determines the width and the peak at wl/4 of the profile
wf (float) – Distribution final point that indicates the upper limit
- Returns:
Distribution object
- Return type:
- Raises:
ValueError – If
wf < w0, or if a and b, which determine de evaluation domain in scipy.rv_continuous, do not verifya < w0,b > wfandb > a.
Notes
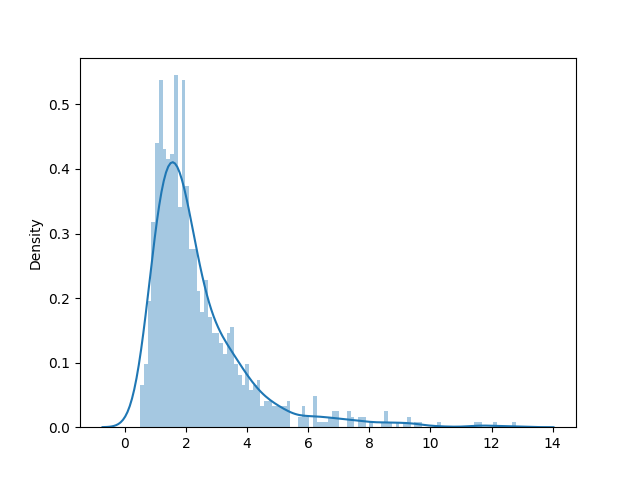
Exponentially Decreasing Space Density is used to represent certain distributions, such as a parallax distribution of a star catalogue [1] [2]. The EDSD distribution is defined as:
f(w) = wl**3 / 2*(w-w0)**4 * exp(-wl/(w-w0))ifw > w0andw < wff(w) = 0ifw <= w0f(w) = 0ifw >= wf
where:
w: parallax in masw0: distribution zero point that indicates the lower limitwl: parameter that determines the width and the peak at wl/4 of the profilewf: distribution final point that indicates the upper limit from which the distribution is zero. This is added to make the function domain limited to[w0, wf], so other values outside this range are not evaluated.
References
Examples
1import matplotlib.pyplot as plt
2import seaborn as sns
3
4from scludam.synthetic import EDSD
5
6edsd = EDSD(w0=0, wl=5, wf=14)
7data = edsd.rvs(1000)
8sns.distplot(data, bins=100)
9plt.show()
- pdf(x: Number | Annotated[ndarray[Any, dtype[number]], beartype.vale.IsAttr['ndim', beartype.vale.IsEqual[1]]]) Annotated[ndarray[Any, dtype[number]], beartype.vale.IsAttr['ndim', beartype.vale.IsEqual[1]]][source]
Probability density function of the EDSD distribution.
- Parameters:
x (Union[Number, Numeric1DArray]) – Data to be evaluated.
- Returns:
PDF values.
- Return type:
Numeric1DArray
Notes
The PDF is defined as the density profile given in [1] [2], but it is not used for random generation. Instead, a Percent Point Function approximation is used.
- cdf(x: Number | Annotated[ndarray[Any, dtype[number]], beartype.vale.IsAttr['ndim', beartype.vale.IsEqual[1]]]) Annotated[ndarray[Any, dtype[number]], beartype.vale.IsAttr['ndim', beartype.vale.IsEqual[1]]][source]
Cumulative distribution function.
- Parameters:
x (Numeric1DArray)
- Returns:
Cumulative distribution function.
- Return type:
Numeric1DArray
Notes
The CDF is a polinomial approximation of the real CDF function.
- ppf(y: Number | Annotated[ndarray[Any, dtype[number]], beartype.vale.IsAttr['ndim', beartype.vale.IsEqual[1]]]) Annotated[ndarray[Any, dtype[number]], beartype.vale.IsAttr['ndim', beartype.vale.IsEqual[1]]][source]
Percent point function.
- Parameters:
y (Numeric1DArray)
- Returns:
Percent point function.
- Return type:
Numeric1DArray
Notes
The PPF is a polinomial approximation of the real PPF. As cdf and ppf are approximations, one is close to the inverse of the other, but not exactly.
- class scludam.synthetic.UniformSphere(center: ]] = (0.0, 0.0, 0.0), radius: Number = 1.0)[source]
Bases:
multi_rv_frozenClass to represent the Uniform Sphere distribution.
- Variables:
center (Vector3) – Center of the sphere.
radius (Number) – Radius of the sphere.
- rvs(size: int = 1) shape[1] == 3]][source]
Generate random sample from the Uniform Sphere distribution.
- Parameters:
size (int, optional) – Number of samples to be generated, by default 1
- Returns:
Numpy numeric array of shape (size, 3) with the samples.
- Return type:
Vector3Array
- pdf(x: ]]) Annotated[ndarray[Any, dtype[number]], beartype.vale.IsAttr['ndim', beartype.vale.IsEqual[1]]][source]
Probability density function of the Uniform Sphere distribution.
Is calculated as 0 if the point is outside the sphere, and 1 divided by the volume of the sphere otherwise.
- Parameters:
x (Union[Vector3, Vector3Array]) – Data to be evaluated
- Returns:
Numpy numeric array of shape (size,) with the pdf values.
- Return type:
Numeric1DArray
- class scludam.synthetic.UniformFrustum(locs: ]], scales: ]], max_size_per_iter: int = 10000000)[source]
Bases:
multi_rv_frozenClass to represent the Uniform Frustum distribution.
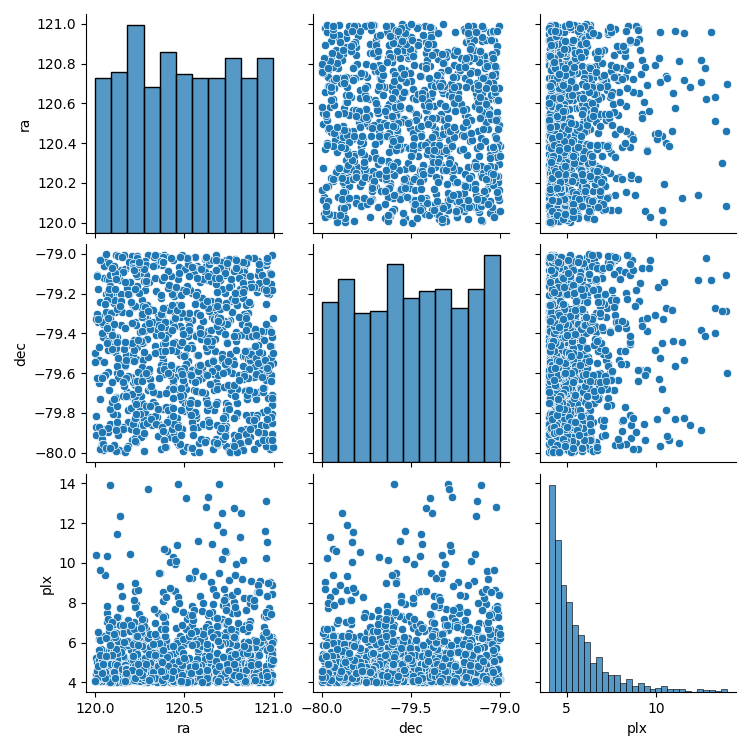
It was defined to represent a square sky region sample. It represents a uniform distribution inside a pyramidal frustum.
- Variables:
locs (Vector3) – Reference corner of the frustum. It is given by (ra, dec, parallax) polar coordinates in ICRS system, in (degree, degree, mas).
scales (Vector3) – Size of the frustum in (ra, dec, parallax) polar coordinates in ICRS, in (degree, degree, mas).
max_size_per_iter (int, optional) – Maximum number of samples to be generated per iteration, by default 1e7. A bigger value can reduce the amount of time needed to generate the sample, but take more memory.
Examples
 1import matplotlib.pyplot as plt
 2import pandas as pd
 3import seaborn as sns
 4
 5from scludam.synthetic import UniformFrustum, cartesian_to_polar
 6
 7# parallax between 14 and 4 arcsec
 8uf = UniformFrustum(locs=(120, -80, 14), scales=(1, 1, -10))
 9# points in cartesian coordinates in parsecs
10data = uf.rvs(1000)
11# distribution in spherical coordinates
12sns.pairplot(pd.DataFrame(cartesian_to_polar(data), columns=["ra", "dec", "plx"]))
13plt.show()
- rvs(size: int = 1) shape[1] == 3]][source]
Generate random sample from the Uniform Frustum distribution.
- Parameters:
size (int, optional) – size of the random sample, by default 1
- Returns:
numpy numeric array of shape (size, 3) with the samples.
- Return type:
Vector3Array
- Raises:
ValueError – If the given locs are not a valid ICRS coordinate.
- pdf(data: ]]) Annotated[ndarray[Any, dtype[number]], beartype.vale.IsAttr['ndim', beartype.vale.IsEqual[1]]][source]
Probability density function of the Uniform Frustum distribution.
It is defined as 1 / volume of the frustum for the points inside the frustum, and 0 for the points outside.
- Parameters:
data (Union[Vector3, Vector3Array]) – numpy numeric array to be evaluated.
- Returns:
PFD values.
- Return type:
Numeric1DArray
- Raises:
ValueError – If the given locs are not a valid ICRS coordinate.
- class scludam.synthetic.UniformCircle(center: ]] = (0.0, 0.0), radius: Number = 1.0)[source]
Bases:
multi_rv_frozenUniform Circle distribution.
- Variables:
center (Vector2) – center of the circle.
radius (Number) – radius of the circle.
- pdf(x: ]]) Annotated[ndarray[Any, dtype[number]], beartype.vale.IsAttr['ndim', beartype.vale.IsEqual[1]]][source]
Probability density function of the Uniform Circle distribution.
It is defined as 1 / (pi * radius^2) for the points inside the circle, and 0 for the points outside.
- Parameters:
x (Union[Vector2, Vector2Array]) – numpy numeric array to be evaluated.
- Returns:
Numpy numeric array of shape with the pdf values.
- Return type:
Numeric1DArray
- class scludam.synthetic.BivariateUniform(locs: ]] = (0.0, 0.0), scales: ]] = (1.0, 1.0))[source]
Bases:
multi_rv_frozenBivariate Uniform distribution.
- Variables:
locs (Vector2) – center of the bivariate uniform distribution.
scales (Vector2) – scale of the bivariate uniform distribution.
- Returns:
instance of the Bivariate Uniform distribution.
- Return type:
- rvs(size: int = 1) shape[1] == 2]][source]
Generate random sample from the Bivariate Uniform distribution.
- Parameters:
size (int, optional) – size of the sample, by default 1
- Returns:
numpy array of shape (size, 2) with the samples.
- Return type:
Vector2Array
- pdf(x: ]]) Annotated[ndarray[Any, dtype[number]], beartype.vale.IsAttr['ndim', beartype.vale.IsEqual[1]]][source]
Probability density function of the Bivariate Uniform distribution.
- Parameters:
x (Union[Vector2, Vector2Array]) – data to be evaluated.
- Returns:
numpy array with the pdf values.
- Return type:
Numeric1DArray
- class scludam.synthetic.TrivariateUniform(locs: ]] = (0.0, 0.0, 0.0), scales: ]] = (1.0, 1.0, 1.0))[source]
Bases:
multi_rv_frozenTrivariate Uniform distribution.
- Variables:
locs (Vector3) – center of the trivariate uniform distribution.
scales (Vector3) – scale of the trivariate uniform distribution.
- Returns:
instance of the Trivariate Uniform distribution.
- Return type:
- rvs(size: int = 1) shape[1] == 3]][source]
Generate random sample from the Trivariate Uniform distribution.
- Parameters:
size (int, optional) – size of the sample, by default 1
- Returns:
Numpy array of shape (size, 3) with the samples.
- Return type:
Vector3Array
- pdf(x: ]]) Annotated[ndarray[Any, dtype[number]], beartype.vale.IsAttr['ndim', beartype.vale.IsEqual[1]]][source]
Probability density function of the Trivariate Uniform distribution.
Is defined as 1 / volume for the points inside the volume, and 0 for the points outside.
- Parameters:
x (Union[Vector3, Vector3Array]) – Points to be evaluated.
- Returns:
Numpy array with the pdf values.
- Return type:
Numeric1DArray
- class scludam.synthetic.StarCluster(space: multi_rv_frozen, pm: multi_rv_frozen, representation_type: str = 'spherical', n_stars: int = 200)[source]
Bases:
objectClass for generating astrometric data from a star cluster.
- Variables:
space (stats._multivariate.multi_rv_frozen) – Space distribution of the cluster. It must have 3 dimensions.
pm (stats._multivariate.multi_rv_frozen) – Proper motion distribution of the cluster. It must have 3 dimensions.
representation_type (str) – Type of representation of the cluster. It must be “spherical” or “cartesian”, by default “spherical”.
- Returns:
An instance of the StarCluster class.
- Return type:
- rvs() DataFrame[source]
Generate random sample from the Star Cluster distribution.
- Returns:
Data frame with the samples.
- Return type:
pd.DataFrame
- pdf(data: DataFrame) Annotated[ndarray[Any, dtype[number]], beartype.vale.IsAttr['ndim', beartype.vale.IsEqual[1]]][source]
Joint probability density function of the StarCluster distribution.
- Parameters:
data (pd.DataFrame) – Data to be evaluated. Must contain the columns “ra”, “dec”, “parallax” or “x”, “y”, “z”, and “pmra”, “pmdec”.
- Returns:
PDF values for the data.
- Return type:
Numeric1DArray
- pm_pdf(data: DataFrame) Annotated[ndarray[Any, dtype[number]], beartype.vale.IsAttr['ndim', beartype.vale.IsEqual[1]]][source]
Probability density function of the Proper Motion distribution.
- Parameters:
data (pd.DataFrame) – Data to be evaluated.
- Returns:
PDF values for the data.
- Return type:
Numeric1DArray
- space_pdf(data: DataFrame) Annotated[ndarray[Any, dtype[number]], beartype.vale.IsAttr['ndim', beartype.vale.IsEqual[1]]][source]
Probability density function of the space distribution.
- Parameters:
data (pd.DataFrame) – Data to be evaluated. Must have columns “x”, “y”, “z” or “ra”, “dec”, “parallax”.
- Returns:
PDF values for the data.
- Return type:
Numeric1DArray
- class scludam.synthetic.StarField(space: multi_rv_frozen, pm: multi_rv_frozen, representation_type: str = 'spherical', n_stars: int = 100000)[source]
Bases:
objectClass for generating star field data.
- Variables:
space (stats._multivariate.multi_rv_frozen) – Distribution of the space coordinates. Must have 3 dimensions.
pm (stats._multivariate.multi_rv_frozen) – Distribution of the proper motion coordinates. Must have 2 dimensions.
representation_type (str) – Type of representation of the spatial data. Must be “cartesian” or “spherical”, by default “spherical”.
- Returns:
An instance of the StarField class.
- Return type:
- rvs() DataFrame[source]
Generate random sample from the Star Field distribution.
- Returns:
Contains columns for the space distrubution and the pm distribution.
- Return type:
pd.DataFrame
- pdf(data: DataFrame) Annotated[ndarray[Any, dtype[number]], beartype.vale.IsAttr['ndim', beartype.vale.IsEqual[1]]][source]
Joint Probability Density Function of the Star Field.
- Parameters:
data (pd.DataFrame) – Data to be evaluated.
- Returns:
PDF values for the data.
- Return type:
Numeric1DArray
- pm_pdf(data: DataFrame) Annotated[ndarray[Any, dtype[number]], beartype.vale.IsAttr['ndim', beartype.vale.IsEqual[1]]][source]
Probability density function of the Proper Motion distribution.
- Parameters:
data (pd.DataFrame) – Data to be evaluated. Must have columns “pmra” and “pmdec”.
- Returns:
PDF of the Proper Motion distribution.
- Return type:
Numeric1DArray
- space_pdf(data: DataFrame) Annotated[ndarray[Any, dtype[number]], beartype.vale.IsAttr['ndim', beartype.vale.IsEqual[1]]][source]
Probability density function of the space distribution.
- Parameters:
data (pd.DataFrame) – Data to be evaluated. Must have columns “x”, “y”, “z” or “ra”, “dec”, “parallax”.
- Returns:
PDF of the space distribution.
- Return type:
Numeric1DArray
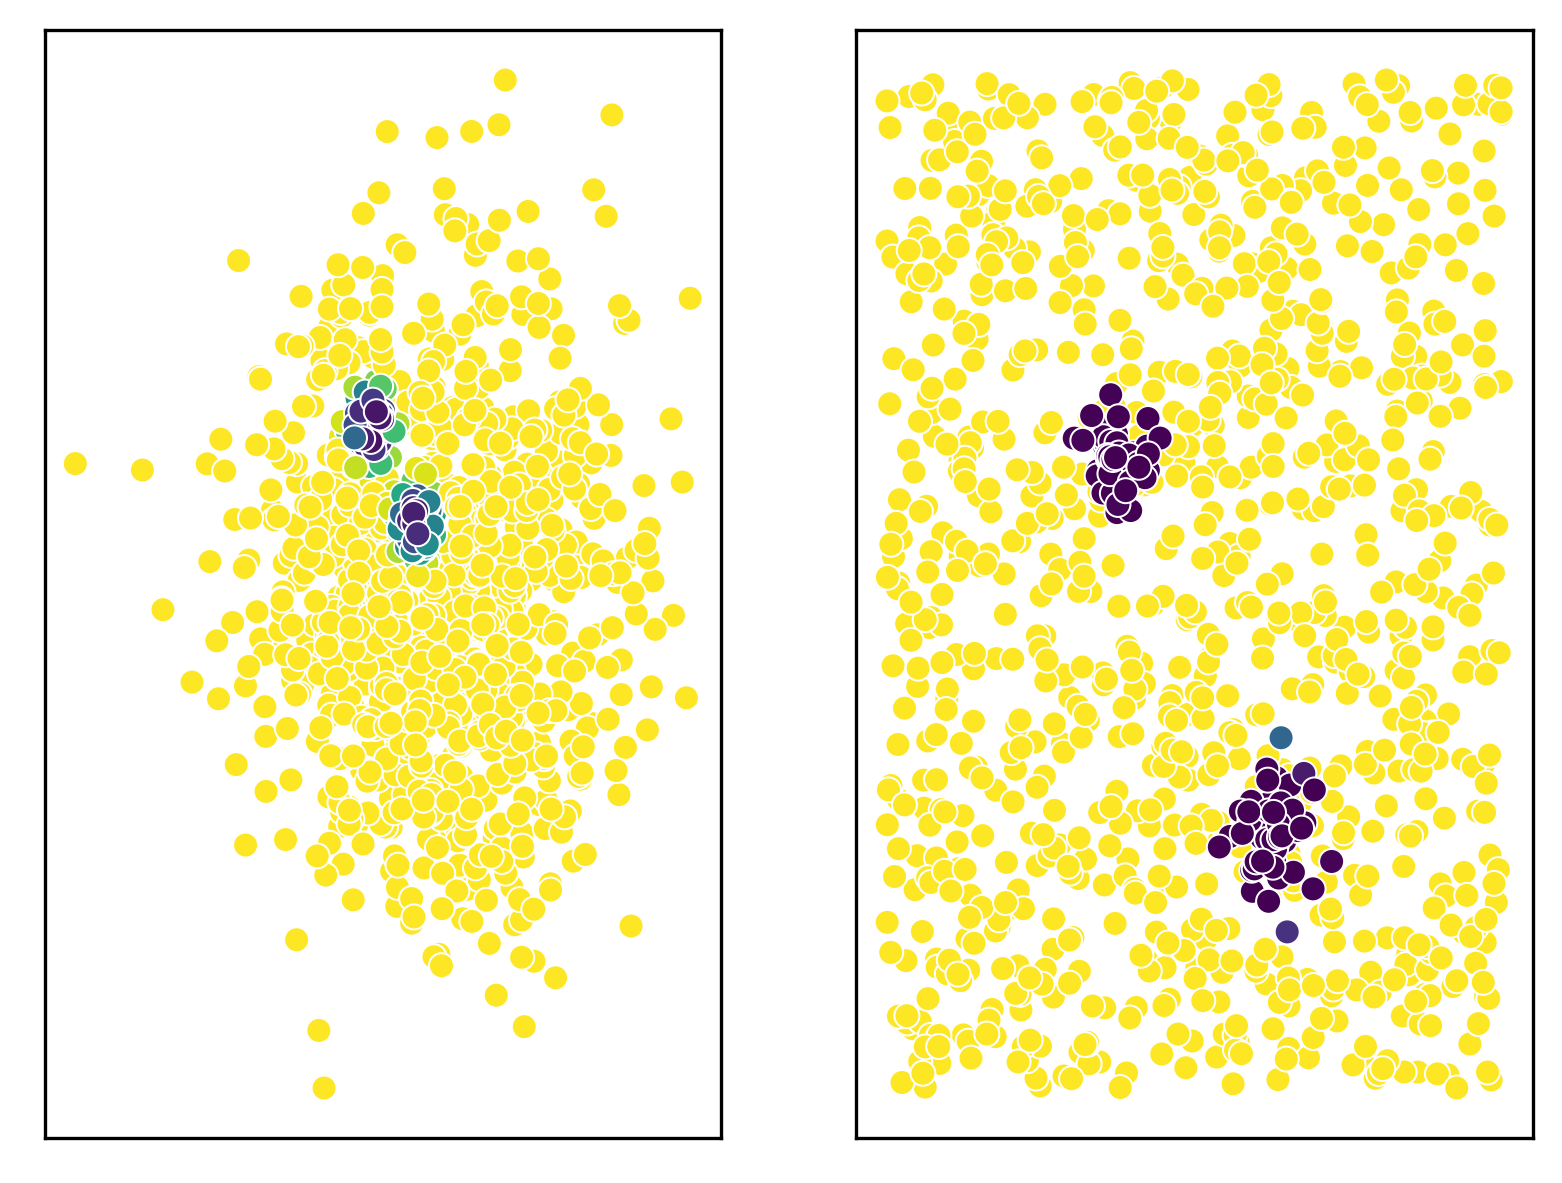
- class scludam.synthetic.Synthetic(star_field: StarField, representation_type: str = 'spherical', clusters: List[StarCluster] = NOTHING)[source]
Bases:
objectClass for generating synthetic data.
- Variables:
space (stats._multivariate.multi_rv_frozen) – The space distribution, it must be a 3d distribution.
pm (stats._multivariate.multi_rv_frozen) – The proper motion distribution, it must be a 2d distribution.
representation_type (str) – The representation type, it must be “cartesian” or “spherical”, by default is “spherical”.
Examples
 1import matplotlib.pyplot as plt
 2import seaborn as sns
 3from scipy.stats import multivariate_normal
 4
 5from scludam.synthetic import (
 6    StarCluster,
 7    StarField,
 8    Synthetic,
 9    UniformFrustum,
10    polar_to_cartesian,
11)
12
13data = Synthetic(
14    star_field=StarField(
15        pm=multivariate_normal((-5, 6), cov=3.0),
16        space=UniformFrustum(locs=(118, -31, 8), scales=(2, 2, -7)),
17        n_stars=1000,
18    ),
19    clusters=[
20        StarCluster(
21            space=multivariate_normal(
22                mean=polar_to_cartesian([118.75, -29.75, 1.5]), cov=1 / 3
23            ),
24            pm=multivariate_normal(mean=(-5.4, 6.75), cov=1.0 / 34),
25            n_stars=50,
26        ),
27        StarCluster(
28            space=multivariate_normal(
29                mean=polar_to_cartesian([119.25, -30.5, 2]), cov=1 / 3
30            ),
31            pm=multivariate_normal(mean=(-6.25, 7.75), cov=1.0 / 34),
32            n_stars=50,
33        ),
34    ],
35    representation_type="spherical",
36).rvs()
37
38fig, ax = plt.subplots(ncols=2)
39sns.scatterplot(
40    data=data, x="pmra", y="pmdec", hue="p_pm_field", palette="viridis", ax=ax[0]
41)
42sns.scatterplot(
43    data=data, x="ra", y="dec", hue="p_space_field", palette="viridis", ax=ax[1]
44)
45plt.show()