scludam.membership module
Module for Density Based Membership Estimation.
- class scludam.membership.DBME(n_iters: int = 2, kde_leave1out: bool = True, kernel_calculation_mode: str = 'per_class', pdf_estimator: HKDE = HKDE(bw=RuleOfThumbSelector(rule='scott', diag=False), error_convolution=False, _kernels=None, _weights=None, _covariances=None, _base_bw=None, _data=None, _n=None, _d=None, _n_eff=None, _eff_mask=None, _maxs=None, _mins=None), n: int | None = None, d: int | None = None, unique_labels: Annotated[ndarray[Any, dtype[number]], beartype.vale.IsAttr['ndim', beartype.vale.IsEqual[1]]] | None = None, data: Annotated[ndarray[Any, dtype[number]], beartype.vale.IsAttr['ndim', beartype.vale.IsEqual[2]]] | None = None, estimators: list = NOTHING, n_estimators: int | None = None, iter_priors: list = NOTHING, iter_counts: list = NOTHING, iter_label_diff: list = NOTHING, iter_labels: list = NOTHING, n_classes: int | None = None, labels: Annotated[ndarray[Any, dtype[number]], beartype.vale.IsAttr['ndim', beartype.vale.IsEqual[1]]] | None = None, counts: Annotated[ndarray[Any, dtype[number]], beartype.vale.IsAttr['ndim', beartype.vale.IsEqual[1]]] | None = None, posteriors: Annotated[ndarray[Any, dtype[number]], beartype.vale.IsAttr['ndim', beartype.vale.IsEqual[2]]] | None = None, priors: Annotated[ndarray[Any, dtype[number]], beartype.vale.IsAttr['ndim', beartype.vale.IsEqual[1]]] | None = None)[source]
Bases:
objectDensity Based Membership Estimation.
It uses
HKDEto estimate the density and calculate smooth membership probabilities for each class, given data and initial probabilities.- Variables:
n_iters (int) – Number of iterations, by default 2. In each iteration, prior probabilities are updated according to the posterior probabilities of the previous iteration.
kernel_calculation_mode (str) –
Mode of kernel calculation, by default
per_class. It indicates how manyHKDEestimators will be used to estimate the density. Available modes are:same: the bandwidth of the kernels is the same for all classes. There will be one estimator.per_class: the bandwidth of the kernels is different for each class. There will be one estimator per class.per_class_per_iter: the bandwidth of the kernels is different for each class and iteration. There will be one estimator per class which will be updated in each iteration, recalculating the bandwith each time.
kde_leave1out (bool) – Whether to use leave-one-out KDE estimation, by default True.
pdf_estimator (Union[
HKDE, List[HKDE]]) – Estimator used to estimate the density, by default an instance of HKDE with default parameters. If list is provided, it is asumed either 1 per class or first for first class and 2nd for the rest.n_classes (int) – Number of detected classes. Only available after the
fit()method is called.labels (Numeric1DArray) – Labels of the classes, only available after the
fit()method is called.counts (Numeric1DArray) – Number of data points in each class, only available after the
fit()method is called.priors (Numeric1DArray) – Prior probabilities of each class, only available after the
fit()method is called.posteriors (Numeric2DArray) – Posterior probabilities array of shape (n_datapoints, n_classes), only available after the
fit()method is called.
Examples
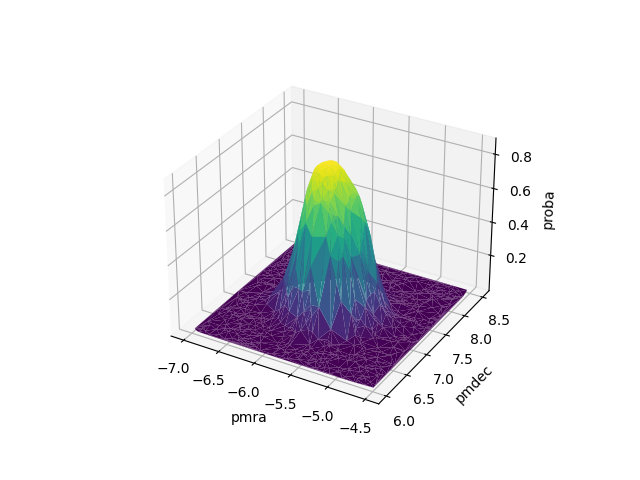
 1import matplotlib.pyplot as plt
 2import numpy as np
 3from scipy.stats import multivariate_normal
 4
 5from scludam import DBME, SHDBSCAN
 6from scludam.synthetic import (
 7    BivariateUniform,
 8    StarCluster,
 9    StarField,
10    Synthetic,
11    UniformFrustum,
12    polar_to_cartesian,
13)
14
15# generate some data
16
17fmix = 0.9
18n = 1000
19n_clusters = 1
20cmix = (1 - fmix) / n_clusters
21
22field = StarField(
23    pm=BivariateUniform(locs=(-7, 6), scales=(2.5, 2.5)),
24    space=UniformFrustum(locs=(118, -31, 1.2), scales=(6, 6, 0.9)),
25    n_stars=int(n * fmix),
26)
27clusters = [
28    StarCluster(
29        space=multivariate_normal(mean=polar_to_cartesian([121, -28, 1.6]), cov=50),
30        pm=multivariate_normal(mean=(-5.75, 7.25), cov=1.0 / 34),
31        n_stars=int(n * cmix),
32    ),
33]
34df = Synthetic(star_field=field, clusters=clusters).rvs()
35
36data = df[["pmra", "pmdec"]].values
37
38# create some random observational error
39random_error = np.random.normal(0, 0.1, data.shape)
40
41# calculate some initial probabilities
42shdbscan = SHDBSCAN(
43    min_cluster_size=150, noise_proba_mode="outlier", auto_allow_single_cluster=True
44).fit(data)
45
46# use DBME to fit HKDE models and calculate membership probabilities
47dbme = DBME().fit(data, shdbscan.proba, random_error)
48print(dbme.posteriors)
49# [[9.45802647e-01 5.41973532e-02]
50#  ...
51#  [2.77988823e-01 7.22011177e-01]]
52
53# plot to compare initial probabilities with membership probabilities
54shdbscan.surfplot(cols=["pmra", "pmdec"])
55dbme.surfplot(cols=["pmra", "pmdec"])
56plt.show()

- fit(data: Annotated[ndarray[Any, dtype[number]], beartype.vale.IsAttr['ndim', beartype.vale.IsEqual[2]]], init_proba: Annotated[ndarray[Any, dtype[number]], beartype.vale.IsAttr['ndim', beartype.vale.IsEqual[2]]], err: Annotated[ndarray[Any, dtype[number]], beartype.vale.IsAttr['ndim', beartype.vale.IsEqual[2]]] | None = None, corr: ndarray[Any, dtype[number]] | None = None)[source]
Fit models and calculate posteriors probabilities.
The method takes data and initial probabilities and creates density estimators. Prior probabilities are taken from the initial probabilities. In each iteration, the method calculates the posterior probabilities of each datapoint using the density estimates and prior probabilites. Also, the method updates the prior probabilities considering the posterior probabilities of the past iteration.
n_iters=1uses prior probabilities as provided in the initial probabilities array.n_iters=2(recommended), updates the prior probabilities once.- Parameters:
data (Numeric2DArray) – Data matrix.
init_proba (Numeric2DArray) – Initial posterior probability array. Must be of shape (n_samples, n_classes). This probabilities are used to create the initial density estimators per class.
err (OptionalNumeric2DArray, optional) – Error parameter to be passed to
fit(), by default None.corr (OptionalNumericArray, optional) – Correlation parameter to be passed to
fit(), by default None.
- Returns:
Fitted instance of the
DBMEclass.- Return type:
- pairplot(**kwargs)[source]
Plot the clustering results in a pairplot.
It uses the
pairprobaplot(). The colors of the points represent class labels. The sizes of the points reresent the probability of belonging to the most probable class.- Returns:
Pairplot of the clustering results.
- Return type:
seaborn.PairGrid
- Raises:
Exception – If the clustering has not been performed yet.
- tsneplot(**kwargs)[source]
Plot the clustering results in a t-SNE plot.
It uses the
tsneprobaplot()function. It represents the data in a 2 dimensional space using t-SNE. The colors of the points represent class labels. The sizes of the points represent the probability of belonging to the most probable class.- Returns:
Plot of the clustering results.
- Return type:
matplotlib.axes.Axes
- Raises:
Exception – If the clustering has not been performed yet.
- scatter3dplot(**kwargs)[source]
Plot the clustering results in a 3D scatter plot.
It uses the
scatter3dprobaplot()function. It represents the data in a 3 dimensional space using the variables given by the user. The colors of the points represent class labels. The sizes of the points represent the probability of belonging to the most probable class.- Returns:
Plot of the clustering results.
- Return type:
matplotlib.collections.PathCollection
- Raises:
Exception – If the clustering has not been performed yet.
- surfplot(**kwargs)[source]
Plot the clustering results in a 3D surface plot.
It uses the
surfprobaplot()function. The heights of the surface and colors of the points represent the probability of belonging to the most probable cluster, excluding the noise class. The data is represented in two dimensions, given by the user.- Returns:
Plot of the clustering results.
- Return type:
matplotlib.collections.PathCollection
- Raises:
Exception – If the clustering has not been performed yet.