scludam.pipeline module
Module with default Detection and Membership Estimation Pipeline.
All steps of the process can be configured following the documentation for each function.
Examples
1import matplotlib.pyplot as plt
2
3from scludam import DEP, CountPeakDetector, HopkinsTest, Query, RipleysKTest
4
5# search some data from GAIA
6# with error and correlation
7# columns for better KDE
8df = (
9 Query()
10 .select(
11 "ra",
12 "dec",
13 "ra_error",
14 "dec_error",
15 "ra_dec_corr",
16 "pmra",
17 "pmra_error",
18 "ra_pmra_corr",
19 "dec_pmra_corr",
20 "pmdec",
21 "pmdec_error",
22 "ra_pmdec_corr",
23 "dec_pmdec_corr",
24 "pmra_pmdec_corr",
25 "parallax",
26 "parallax_error",
27 "parallax_pmra_corr",
28 "parallax_pmdec_corr",
29 "ra_parallax_corr",
30 "dec_parallax_corr",
31 "phot_g_mean_mag",
32 )
33 # search for this identifier in simbad
34 # and bring data in a circle of radius
35 # 1/2 degree
36 .where_in_circle("ngc2168", 0.5)
37 .where(("parallax", ">", 0))
38 .where(("phot_g_mean_mag", "<", 18))
39 # include some common criteria
40 # for data precision
41 .where_arenou_criterion()
42 .where_aen_criterion()
43 .get()
44 .to_pandas()
45)
46
47# If data already has been downloaded, you can load it from a file:
48# > from astropy.table.table import Table
49# > df = Table.read("path_to_my_file/ngc2168_data.fits").to_pandas()
50
51
52# Build Detection-Estimation Pipeline
53dep = DEP(
54 # Detector configuration for the detection step
55 detector=CountPeakDetector(
56 bin_shape=[0.3, 0.3, 0.07],
57 min_score=3,
58 min_count=5,
59 ),
60 det_cols=["pmra", "pmdec", "parallax"],
61 sample_sigma_factor=2,
62 # Clusterability test configuration
63 tests=[
64 RipleysKTest(pvalue_threshold=0.05, max_samples=100),
65 HopkinsTest(),
66 ],
67 test_cols=[["ra", "dec"]] * 2,
68 # Membership columns to use
69 mem_cols=["pmra", "pmdec", "parallax", "ra", "dec"],
70).fit(df)
71
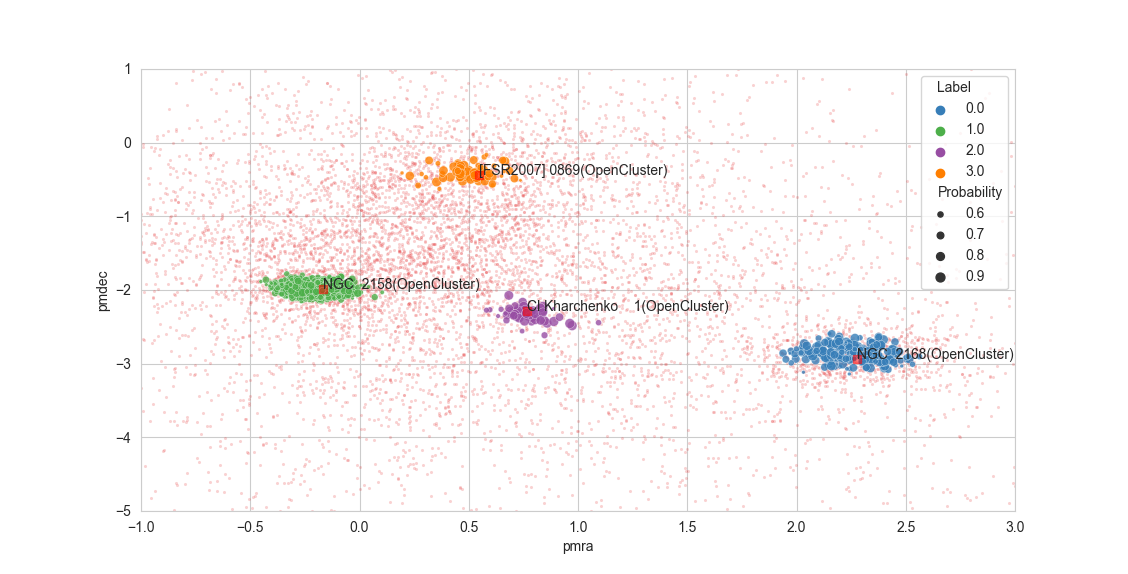
72# plot the results
73dep.scatterplot(["pmra", "pmdec"])
74# zoom on interesting area
75plt.axis([-1, 3, -5, 1])
76plt.show()
77
78# write results to file
79dep.write("ngc2168_result.fits")
- class scludam.pipeline.DEP(detector: CountPeakDetector, det_cols: List[str], tests: List[StatTest] = NOTHING, test_cols: List[List[str]] = NOTHING, clusterer: SHDBSCAN = SHDBSCAN(min_cluster_size=50, auto_allow_single_cluster=True, allow_single_cluster=False, min_samples=None, metric='euclidean', noise_proba_mode='conservative', cluster_proba_mode='hard', outlier_quantile=None, scaler=RobustScaler(), clusterer=None, _data=None, _centers_provided=False, _centers=None, _n=None, _d=None, _unique_labels=None, n_classes=None, proba=None, labels=None, outlier_scores=None), estimator: DBME = DBME(n_iters=2, kde_leave1out=True, kernel_calculation_mode='per_class', pdf_estimator=HKDE(bw=RuleOfThumbSelector(rule='scott', diag=False), error_convolution=False, _kernels=None, _weights=None, _covariances=None, _base_bw=None, _data=None, _n=None, _d=None, _n_eff=None, _eff_mask=None, _maxs=None, _mins=None), _n=None, _d=None, _unique_labels=None, _data=None, _estimators=[], _n_estimators=None, _iter_priors=[], _iter_counts=[], _iter_label_diff=[], _iter_labels=[], n_classes=None, labels=None, counts=None, posteriors=None, priors=None), test_mode: str = 'any', mem_cols: List[str] | None = None, sample_sigma_factor: int = 1, n_detected: int | None = None, n_estimated: int | None = None, test_results: List[List[TestResult]] = NOTHING, detection_result: DetectionResult | None = None, proba: ndarray | None = None, labels: ndarray | None = None, limits: List = NOTHING, masks: List = NOTHING, clusterers: List = NOTHING, estimators: List = NOTHING, is_clusterable: List = NOTHING, df: DataFrame | None = None, colnames: Colnames | None = None, objects: DataFrame | None = None, not_nan_mask: ndarray | None = None, needed_cols: set | None = None, original_df: DataFrame | None = None)[source]
Bases:
objectDetection and membership estimation pipeline.
Class for running detection and membership estimation in a dataframe.
- Variables:
detector (CountPeakDetector) – Detector to use, it is required and should not be fitted.
det_cols (List[str]) – Columns to use for detection. Should be a subset of the columns in the dataframe to be used.
sample_sigma_factor (float, optional) – Factor to multiply the sigma of the detection region, in order to get a region sample for the overdensity detected, by default 1. Take into account that the sigma used is currently the bin shape in each dimension.
tests (List[StatTest], optional) – Statistical tests to use for detection, optional, by default []. The list can include a non fitted instance of
StatTest.test_cols (List[List[str]], optional) – Columns to use for statistical tests, optional, by default []. Note that the list must have the same length as the tests list, and each item is a list of columns to use for the statistical test.
test_mode (str, optional) – Mode to use for statistical tests, optional, by default ‘any’. If ‘any’, the test is considered passed if any of the stat tests results in the rejection of their null hypothesis. Other options are ‘all’ and ‘majority’.
clusterer (SHDBSCAN, optional) – Clusterer to be used to get the initial probabilities. By default, an instance of
SHDBSCANwith the following parameters: auto_allow_single_cluster=True, noise_proba_mode=”conservative”, cluster_proba_mode=”hard”, scaler=RobustScaler() (from sklearn.preprocessing).estimator (DBME, optional) – Estimator to use for membership estimation, by default an instance of
DBMEwith the default parameters.mem_cols (List[str], optional) – Columns to use for membership estimation, by default,
det_cols. Should be a subset of the columns in the dataframe to be used. It is recommended to use the same columns as for detection, or at least some of them, so center estimation can be used for better clustering. For the estimation process, error and correlation columns can be used if they are available in the dataframe. For example, if mem_cols is [‘x’, ‘y’], the program will check if columns ‘x_error’, ‘y_error’, ‘x_y_corr’ are present.n_detected (int) – Output attribute, number of overdensities detected.
detection_result (DetectionResult) – Output attribute, result of the detection.
test_results (List[TestResult]) – Output attribute, list of statistical test results.
is_clusterable (List[bool]) – Output attribute, list of decisions taken in the tests, whether the overdensity can be clustered.
n_estimated (int) – Output attribute, number of overdensities estimated, that is, overdensities that passed the tests.
proba (np.ndarray) – Output attribute, membership probabilities of each cluster found.
labels (np.ndarray) – Output attribute, label of each data point, starting from -1 (noise).
limits (List[Numeric1DArray]) – Output attribute, list of limits used for each detection region.
masks (List[NDArray[bool]]) – Output attribute, list of masks used for each detection region.
clusterers (List[SHDBSCAN]) – Output attribute, list of clusterers used for each detection region.
estimators (List[DBME]) – Output attribute, list of estimators used for each detection region.
- fit(df: DataFrame)[source]
Perform the detection and membership estimation.
NaNs are dropped from the dataframe copy and are not taken into account.
- Parameters:
df (pd.DataFrame) – Data frame.
- Returns:
Fitted instance of DEP.
- Return type:
- proba_df(original: bool = True)[source]
Return the data frame with the probabilities.
Returns the full dataframe used for the process added columns for the labels and the probabilites.
- Returns:
Data with probabilities
- Return type:
pd.DataFrame
- Raises:
Exception – If DEP instance is not fitted.
- write(path: str, **kwargs)[source]
Write the data frame with the probabilities to a file.
Writes the data frame used for the process with labels and probabilities to a file. kwargs are passed to the astropy.table.Table.write method. Default kwargs are “overwrite”=True and “format”=”fits”.
- Parameters:
path (str) – Full filepath with filename.
- Raises:
Exception – If DEP instance is not fitted.
- cm_diagram(cols: str = ['bp_rp', 'phot_g_mean_mag'], plotcols: List[str] | None = None, plot_objects: bool = True, **kwargs)[source]
Color-magnitude diagram.
Plots a 2d color magnitude diagram of the data, labels and probabilities. kwargs are passed to the
scatter2dprobaplot(), some useful kwargs are “select_labels” for choosing which clusters to plot and “palette” for choosing the color palette.- Parameters:
cols (list, optional) – Dataframe columns to be used, by default [“bp_rp”, “phot_g_mean_mag”]. If the columns are not present in the dataframe, a KeyError is raised.
plotcols (List[str], optional) – Colnames used for the axis labels in the plot, by default None.
plot_objects (bool, optional) – Whether to plot objects found in the data region, by default True. By default the objects retrieved are of simbad otype “Cl*”, meaning star clusters. This can be changed executing the function
get_simbad_objects().
- Returns:
Axis of the plot
- Return type:
Axes
- Raises:
Exception – If DEP instance is not fitted.
- radec_plot(cols: str = ['ra', 'dec'], plotcols: List[str] | None = None, plot_objects: bool = True, **kwargs)[source]
Color-magnitude diagram.
Plots a 2d color magnitude diagram of the data, labels and probabilities. kwargs are passed to the
scatter2dprobaplot(), some useful kwargs are “select_labels” for choosing which clusters to plot and “palette” for choosing the color palette.- Parameters:
cols (list, optional) – Dataframe columns to be used, by default [“bp_rp”, “phot_g_mean_mag”]. If the columns are not present in the dataframe, a KeyError is raised.
plotcols (List[str], optional) – Colnames used for the axis labels in the plot, by default None.
plot_objects (bool, optional) – Whether to plot objects found in the data region, by default True. By default the objects retrieved are of simbad otype “Cl*”, meaning star clusters. This can be changed executing the function
get_simbad_objects().
- Returns:
Axis of the plot
- Return type:
Axes
- Raises:
Exception – If DEP instance is not fitted.
- scatterplot(cols: List[str] = ['pmra', 'pmdec'], plotcols: List[str] | None = None, plot_objects: bool = True, **kwargs)[source]
Scatter plot with results.
Plots a 2d scatterplot of the data, labels and probabilities. kwargs are passed to the
scatter2dprobaplot(), some useful kwargs are “select_labels” for choosing which clusters to plot and “palette” for choosing the color palette.- Parameters:
cols (List[str], optional) – Dataframe columns to be used, by default [“ra”, “dec”]. If the columns are not present in the dataframe, a KeyError is raised.
plotcols (Optional[List[str]], optional) – Names of the axes labels to be used, by default None. If None,
colsare used.plot_objects (bool, optional) – Whether to plot simbad objects found in the data region, by default True. By default the objects retrieved are of simbad otype “Cl*”, meaning star clusters. This can be changed executing the function
get_simbad_objects().
- Returns:
Axis of the plot
- Return type:
Axes
- Raises:
Exception – If DEP instance is not fitted.
- get_simbad_objects(**kwargs)[source]
Get simbad objects found in the data region.
kwargs are passed to the
search_objects_near_data()function. If executed, scatterplot and cm_diagram will plot the objects found in the data region.- Returns:
Table with the objects found.
- Return type:
astropy.table.Table
- Raises:
Exception – If DEP instance is not fitted.